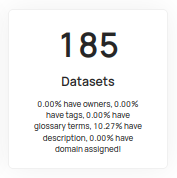
Hi team! Does anyone know what are the graphQL queries behind the Analytics page? In particular, the ones about the datasets (% of datasets without owner, % of dataset without descriptions…). I want to build some custom metrics (such as total number of datasets without owner) and these queries would be a good baseline since I’m not very familiar with graphQL. Thanks in advance! ![]()
for DIY, open browser dev tools when you load the page and observe the queries sent
Thanks <@U01TCN40JKV>! I’ve tried that but it makes a getHighlights query (https://datahubproject.io/docs/graphql/queries#gethighlights) which doesn’t give me much info
i dont think there’s room to configure options before you query getAnalyticsCharts or getHighlights
I guess it would be awesome to know the queries/code behind the getHighlights function. Tried to look in github without luck
Queries are in the different resolvers https://github.com/datahub-project/datahub/tree/2f0616ea5b2c1927107a4726773c907a59a0483f/datahub-graphql-core/src/main/java/com/linkedin/datahub/graphql/analytics/resolver|https://github.com/datahub-project/datahub/tree/2f0616ea5b2c1927107a4726773c907a59[…]e/src/main/java/com/linkedin/datahub/graphql/analytics/resolver
They (or most of them) are solved directly with datahub usage index in Elasticesearch.